fiat_implot: widget for 1D and 2D numpy arrays#
Fiatlight provides SimplePlotGui, a viewer for numpy arrays that allows to plot 1D and 2D arrays with ImPlot
ImPlot is a very capable and fast plotting library, not limited to simple 1D and 2D plots. It is available with Fiatlight and ImGui Bundle (on which Fiatlight is based). See online demo of ImPlot for more examples.
It is faster than Matplotlib within Fiatlight, and well adapted for real time plots (can refresh at 120FPS +)
Example#
from fiatlight.fiat_kits.fiat_implot import demo_implot

demo_implot.main()
Fiat attributes available for SimplePlotGui#
Here is a list of all the type handled by SimplePlotGui:
%%bash
fiatlight types FloatMatrix_Dim
+----------------------------------------------------+---------------------------------------------------------------------+
| Data Type                                          | Gui Type                                                            |
+====================================================+=====================================================================+
| fiatlight.fiat_kits.fiat_implot.array_types.FloatM | fiatlight.fiat_kits.fiat_implot.simple_plot_gui.SimplePlotGui       |
| atrix_Dim1                                         |   A GUI for presenting 1D or 2D arrays with ImPlot. Can present the |
|   synonym for a 1D ndarray of floats (NewType)     | array as a line, scatter (+ stairs, or bars plot, if the array is   |
|                                                    | small enough)                                                       |
+----------------------------------------------------+---------------------------------------------------------------------+
| fiatlight.fiat_kits.fiat_implot.array_types.FloatM | fiatlight.fiat_kits.fiat_implot.simple_plot_gui.SimplePlotGui       |
| atrix_Dim2                                         |   A GUI for presenting 1D or 2D arrays with ImPlot. Can present the |
|   synonym for a 2D ndarray of floats (NewType)     | array as a line, scatter (+ stairs, or bars plot, if the array is   |
|                                                    | small enough)                                                       |
+----------------------------------------------------+---------------------------------------------------------------------+
Here is a list of all the possible customizations options:
%%bash
fiatlight gui SimplePlotGui
GUI type: SimplePlotGui
========================
  A GUI for presenting 1D or 2D arrays with ImPlot. Can present the array as a line, scatter (+ stairs, or bars plot, if the array is small enough)

  Available custom attributes for SimplePlotGui:
  --------------------------------------------------------------------------------
  +-----------------------+---------------------+--------------+------------------------------------------------+
  | Name                  | Type                | Default      | Explanation                                    |
  +=======================+=====================+==============+================================================+
  | plot_type             | str                 | line         | The type of presentation to use. Choose from   |
  |                       |                     |              | line, scatter, stairs, or bars.                |
  +-----------------------+---------------------+--------------+------------------------------------------------+
  | plot_size_em          | tuple[float, float] | (35.0, 20.0) | Size in em units (i.e. multiples of the font   |
  |                       |                     |              | height)                                        |
  +-----------------------+---------------------+--------------+------------------------------------------------+
  | auto_fit              | bool                | True         | Auto-scale the plot axes                       |
  +-----------------------+---------------------+--------------+------------------------------------------------+
  | small_array_threshold | int                 | 100          | The threshold for the array size to be able to |
  |                       |                     |              | present scatter, bars, and stairs plots        |
  +-----------------------+---------------------+--------------+------------------------------------------------+

  Available custom attributes for AnyDataWithGui Generic attributes:
  --------------------------------------------------------------------------------
  +----------------+--------+---------------------+------------------------------------------------+
  | Name           | Type   | Default             | Explanation                                    |
  +================+========+=====================+================================================+
  |                |        |                     | **Generic attributes**                         |
  +----------------+--------+---------------------+------------------------------------------------+
  | validate_value | object | None                | Function to validate a parameter value (should |
  |                |        |                     | return DataValidationResult.ok() .error()      |
  +----------------+--------+---------------------+------------------------------------------------+
  | label          | str    |                     | A label for the parameter. If empty, the       |
  |                |        |                     | function parameter name is used                |
  +----------------+--------+---------------------+------------------------------------------------+
  | tooltip        | str    |                     | An optional tooltip to be displayed            |
  +----------------+--------+---------------------+------------------------------------------------+
  | label_color    | ImVec4 | ImVec4(0.000000,    | The color of the label (will use the default   |
  |                |        | 0.000000, 0.000000, | text color if not provided)                    |
  |                |        | 1.000000)           |                                                |
  +----------------+--------+---------------------+------------------------------------------------+

Code to test this GUI type:
----------------------------
```python
import typing
import fiatlight

@fiatlight.with_fiat_attributes(
    floatmatrix_param__plot_type = "line",
    floatmatrix_param__plot_size_em = (35.0, 20.0),
    floatmatrix_param__auto_fit = True,
    floatmatrix_param__small_array_threshold = 100,
    #  Generic attributes
    floatmatrix_param__validate_value = None,
    floatmatrix_param__label = "",
    floatmatrix_param__tooltip = "",
    floatmatrix_param__label_color = ImVec4(0.000000, 0.000000, 0.000000, 1.000000))
def f(floatmatrix_param: fiatlight.fiat_kits.fiat_implot.array_types.FloatMatrix) -> fiatlight.fiat_kits.fiat_implot.array_types.FloatMatrix:
    return floatmatrix_param

fiatlight.run(f)
```
Source code for the example#
import fiatlight
from fiatlight.fiat_notebook import look_at_code  # noqa
%look_at_python_file fiat_kits/fiat_implot/demo_implot.py
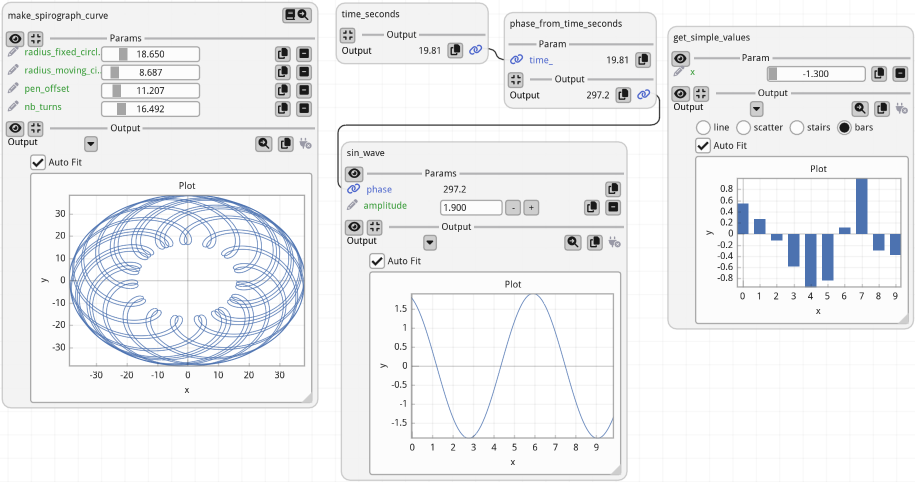
"""Demonstrates plots generated using ImPlot (https://github.com/epezent/implot). ImPlot is an immediate mode plotting library for Dear ImGui, whose rendering is often faster than MatPlotLib.

This example demonstrates
- how to create a live sine wave plot with adjustable frequency, phase, and amplitude using ImPlot.
  The frequency, phase, and amplitude can be adjusted interactively using knobs.
- how to create a spirograph-like curve using ImPlot.
"""

from fiatlight import fiat_implot
import fiatlight as fl
import numpy as np
import math
import time

_start_time = time.time()


def time_seconds() -> float:
    return time.time() - _start_time


def phase_from_time_seconds(time_: float) -> float:
    return time_ * 15.0


time_seconds.invoke_always_dirty = True  # type: ignore


def sin_wave(phase: float, amplitude: float = 1.0) -> fiat_implot.FloatMatrix_Dim2:
    x = np.arange(0, 10, 0.1)
    y = np.sin(x + phase) * amplitude
    r = np.stack((x, y))
    return r  # type: ignore


@fl.with_fiat_attributes(
    radius_fixed_circle__range=(0.0, 100.0),
    radius_moving_circle__range=(0.0, 100.0),
    pen_offset__range=(0.0, 100.0),
    nb_turns__range=(0.0, 100.0),
)
def make_spirograph_curve(
    radius_fixed_circle: float = 10.84,
    radius_moving_circle: float = 3.48,
    pen_offset: float = 6.0,
    nb_turns: float = 23.0,
) -> fiat_implot.FloatMatrix_Dim2:
    """a spirograph-like curve"""
    import numpy as np

    t = np.linspace(0, 2 * np.pi * nb_turns, int(500 * nb_turns))
    x = (radius_fixed_circle + radius_moving_circle) * np.cos(t) - pen_offset * np.cos(
        (radius_fixed_circle + radius_moving_circle) / radius_moving_circle * t
    )
    y = (radius_fixed_circle + radius_moving_circle) * np.sin(t) - pen_offset * np.sin(
        (radius_fixed_circle + radius_moving_circle) / radius_moving_circle * t
    )
    return np.array([x, y])  # type: ignore


@fl.with_fiat_attributes(
    x__range=(0.0, 10.0),
    return__plot_type="bars",
    return__auto_fit=False,
    return__plot_size_em=(20, 10),
)
def get_simple_values(x: float) -> fiat_implot.FloatMatrix_Dim1:
    r = []
    for i in range(10):
        r.append(math.cos(x**i))
    return np.array(r)  # type: ignore


def main() -> None:
    graph = fl.FunctionsGraph()
    graph.add_function(make_spirograph_curve)
    graph.add_function(get_simple_values)

    graph.add_function(time_seconds)
    graph.add_function(phase_from_time_seconds)
    graph.add_function(sin_wave)
    graph.add_link("time_seconds", "phase_from_time_seconds")
    graph.add_link("phase_from_time_seconds", "sin_wave")

    fl.run(graph, app_name="Demo ImPlot")


if __name__ == "__main__":
    main()