Introduction
The notebook submodules (immapp.nb and hello_imgui.nb) provide convenient functions for the usage in a local jupyter notebook, with two main modes:
blocking mode: other cells cannot be run in parallel. A screenshot is displayed after the application exits.
non-blocking mode: other cells can be run in parallel. The application window updates live.
Blocking mode
API
immapp.nb.run and hello_imgui.nb.run functions will run a GUI application, wait for it to exit, and display a screenshot of the final application screen in the cell output.
During the application execution, other cells cannot be run.
Parameters
immapp.nb.run and hello_imgui.nb.run accept the same parameters as immapp.run and hello_imgui.run, respectively.
Optional additional parameters to controls the screenshot size (choose only one of the two):
thumbnail_ratio: (default=1.0) You can use it to change the size of the thumbnail. Passing 0.5 will create a thumbnail half the width of the window.
thumbnail_height: (default=0) You can use it to set a fixed height for the thumbnail (in pixels). If 0, the height is computed from the app window size.
Example
The example cell below demonstrates the blocking mode using immapp.nb.run. It shows a sinusoidal curve that can be adjusted with a slider. After closing the application window, a screenshot of the final state is displayed in the cell output.
from imgui_bundle import implot, immapp, imgui
import numpy as np

FREQ = 0.1

def gui():
    global FREQ
    _, FREQ = imgui.slider_float("Frequency", FREQ, 0.01, 1.0)
    x = np.arange(0, 100, 0.1)
    y = np.sin(FREQ * x)
    if implot.begin_plot("My plot"):
        implot.plot_line("Sine wave", y)
        implot.end_plot()


immapp.nb.run(gui, window_size=(600, 350), with_implot=True, thumbnail_height=500)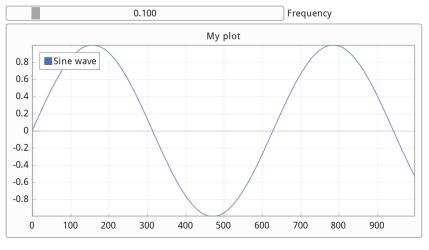
Non blocking mode
(Since v1.92.6)
API
start
immapp.nb.startandhello_imgui.nb.startwill run a GUI application, display it in a top-most window on top of the browser.
Other cells can be run while the application is running. The application window will update live.
Note: these function return an asyncio.Task, which may be awaited or managed using asyncio.
Parameters
immapp.nb.start and hello_imgui.nb.start accept the same parameters as immapp.start and hello_imgui.start, respectively.
Optional additional parameter: top_most to control if the application window should stay on top of other windows.
is_running
immapp.nb.is_runningandhello_imgui.nb.is_runningreturn True if the application is running, False otherwise.
stop
immapp.nb.stopandhello_imgui.nb.stopwill stop the running application.
Note: If other cells are running while the application is running, they should call await asyncio.sleep(0) periodically to allow the application to update.
Example
Start the application
The cell below demonstrates the non-blocking mode using immapp.nb.start. It runs the same application as before (a sinusoidal curve that can be adjusted with a slider). You can modify the frequency while the application is running by changing the value of the FREQ variable in another cell.
When you run it, the cell exits immediately, but the GUI application continues to show and to be interactive (you can then run other cells while the application is running).
Note: since, immapp.nb.start returns an asyncio.Task, you can see that the cell output shows the task information (Task pending, ...).
immapp.nb.start(gui, window_size=(500, 300), with_implot=True, top_most=True)<Task pending name='Task-35' coro=<run_async() running at /Users/pascal/dvp/OpenSource/ImGuiWork/_Bundle/imgui_bundle/bindings/imgui_bundle/immapp/run_async_overloads.py:63>>Interact while the application is running
The cell below shows that it is possible to modify the frequency via code while the application is running, and the curve updates live.
FREQ = 0.5 # Modify frequency while the app is runningCheck if the application is running
The cells below can be used to check if the application is running
immapp.nb.is_running()TrueStop the application
immapp.nb.stop()Video demonstration
Demonstration of the non-blocking mode in a Jupyter notebook.
Example: Real-Time Data Stream Simulation
This example simulates a live data stream that continuously updates, like you might see in a monitoring dashboard or during ML training.
Start the GUI
The cell below instantiate the application data (stream_data) and starts a GUI application that displays the live data stream.
from imgui_bundle import immapp, imgui, hello_imgui, implot
import numpy as np
import time

# Streaming data buffer
stream_data = {
    "values": [],
    "max_points": 500,
    "paused": False
}

def streaming_gui():
    """GUI that shows a live streaming plot"""
    imgui.text("Live Data Stream")
    imgui.text(f"Points: {len(stream_data['values'])}")

    # Control buttons
    if imgui.button("Pause" if not stream_data["paused"] else "Resume"):
        stream_data["paused"] = not stream_data["paused"]

    imgui.same_line()
    if imgui.button("Clear"):
        stream_data["values"].clear()

    imgui.separator()

    # Plot the streaming data
    if len(stream_data["values"]) > 0:
        if implot.begin_plot("Data Stream", hello_imgui.em_to_vec2(40, 15)):
            x_data = np.arange(len(stream_data["values"]), dtype=np.float32)
            y_data = np.array(stream_data["values"], dtype=np.float32)
            implot.setup_axes("x", "y", implot.AxisFlags_.auto_fit, implot.AxisFlags_.auto_fit)
            implot.plot_line("Value", x_data, y_data)
            implot.end_plot()

    if imgui.button("Close"):
        hello_imgui.get_runner_params().app_shall_exit = True

# Start streaming GUI (note: immapp.nb.start is non-blocking
# and immediately returns an asyncio task)
immapp.nb.start(
    streaming_gui,
    window_title="Data Stream Demo",
    window_size=(800, 400),
    with_implot=True,
    top_most=True
)

print("✓ Streaming GUI started!")
print("✓ Run the next cell to start the data stream.")
✓ Streaming GUI started!
✓ Run the next cell to start the data stream.
Simulate Data Stream
The cell below simulates a data stream: this will add data points while the GUI displays them in real-time.
The GUI is already running above (in an asyncio task)
So, we define another asyncio task to add data points (stream_data_loop below), and we run it in async way.
This cell will run for 5 seconds: while it runs, you should see the GUI updating live with new data points.
#

import time
import random
import asyncio

async def stream_data_loop():
    print("Starting data stream... (will run for 10 seconds)")
    start_time = time.time()

    while time.time() - start_time < 5 and immapp.nb.is_running():
        if not stream_data["paused"]:
            # Add new data point
            new_value = np.sin(time.time()) + random.gauss(0, 0.1)
            stream_data["values"].append(new_value)

            # Keep buffer size limited
            if len(stream_data["values"]) > stream_data["max_points"]:
                stream_data["values"].pop(0)

        await asyncio.sleep(0.01) # Yield control to the event loop

    print(f"✓ Stream finished. Final count: {len(stream_data['values'])} points")

# Run the streaming loop
await stream_data_loop()
Starting data stream... (will run for 10 seconds)
✓ Stream finished. Final count: 492 points
Video demonstration
Demonstration of the real-time data stream simulation in a Jupyter notebook.
Example: Real-Time AI Training and tuning
Video demonstration on youtube
Real-Time AI Training and tuning with Dear ImGui Bundle in Jupyter Notebooks
Links to notebooks